Hi,
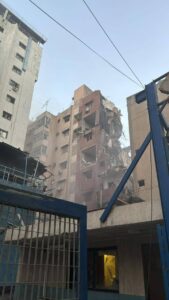
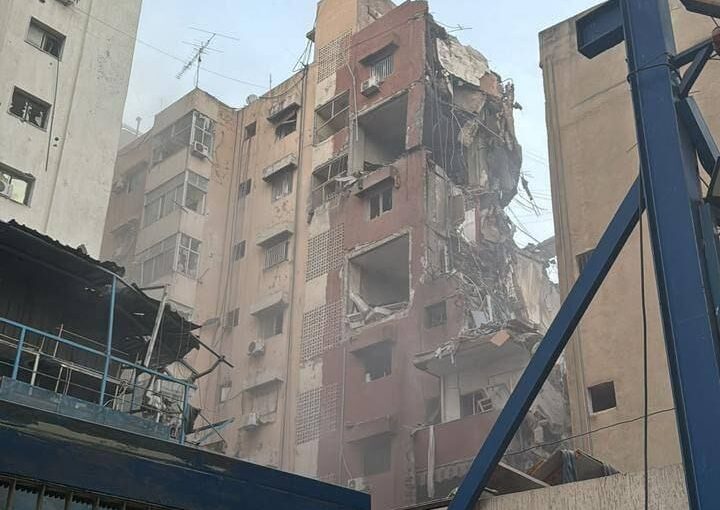
IAF airstrike today, that according to forgien reports aimed at Fuad Shukr, Hezbollah chief of staff, was on a specific apartment in a residential building in the Dahieh suburb of Beirut.
It was an unusual reaction to Hezbollah attacks, and was a clear response on Hezbollah last attack on the Druze town of Majdal Shams, that killed 12 children. Unlike other times, where the strikes on the north did not have reactions, but attacks on the center did have reactions. This is due to the high number of casualties, the fact they were all civilians, and you might say because they were Druze.
Fuad Shukr might be the highest rank Hezbollah member killed in this war. But he was more than that, he was one of the founders of this terror organization. Some even compared it to the killing of Abbas al-Musawi, Hezbollah secretary-general by Israel on February 16th 1992.
The fear is that this attack will break the equations of the war between Hezbollah and Israel along the Lebanon border, where both sides have bookkeeping of the other sides attacks and killing.
Hezbollah did promise to react to the war. What comes to my mind is Hezbollah attack on the Israeli embassy in Buenos Aires in 1992, killing 27 and Buenos Aires and injuring 242 (one of the pupils learned with me in high school lost his mother in this attack)
Take Care
Gad
 The residential building that was the target of IAF airstrike (Source: Abualiexpress Telegram channel)
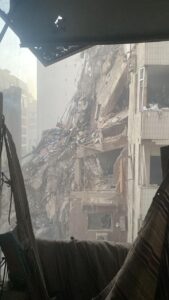
 The ruins of the apartments building Source: Abualiexpress Telegram channel)
 Advertisement by US government of a Reward up to 5 million dollars for information on Fuad Shukr. He was wanted for the key role he took in the 1983 bombing of the U.S. Marine Corps barracks in Beirut, Lebanon, which killed 241 U.S. service personnel (Source: Abualiexpress Telegram channel)

